NHS Friends and Family Test Feedback – a distorted view?

I try to be cautious about big numbers – warning bells ring particularly when the first thing that you read talks about the numbers of responses rather than what the problem is and how it is being solved.
So when I looked at the Friends and Family Test (FFT) web page on the NHS England site and saw that it says that since FFT was launched in 2013 it has produced 55 million pieces of feedback and this feedback is growing at the rate of 1.2m a month I thought it was worth trying to understand this a bit more.
The Friends and Family Test was introduced in 2013 and NHS organisations are mandated to use it to provide a means for the public to give feedback about their experience of using NHS services. The review of friends and family test stated that its aims were to be:
- A tool for local service improvement
- Provide information to empower patient choice
- Intra-trust performance monitoring
- Proved comparable data to hold trusts to account
Context
The NHS sees 1.4m patients every 24 hours. So in crude terms just under 3 in every 100 (1.2m/(1.4m*30))*100 of people give feedback through the Friends and Family Test.
However when you look at the responses in more detail we also see that the rate of feedback varies according to service area.
A caveat about the data
Its’ important to see the data as illustrative – I have cobbled this together from various websites – all sources are shown. However, the figures need to be seen as indicative and as prompts for discussion.
Number of times NHS services are used each year
I have missed out maternity and community because the FFT does not pick this up in the same way.
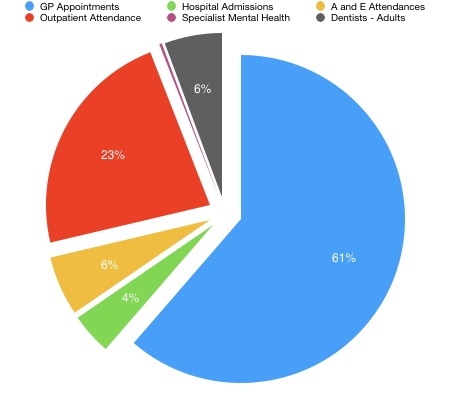
As you can see from the pie chart below the single biggest NHS service by use is General Practice – the table with all my figures in is here. The next largest service is outpatients followed by Dentistry and Accident and Emergency Attendance and so on.
Pie Chart One: NHS Services by number of times used a year
The next pie chart shows where Feedback from Friends and Family has come from by volume of responses. I have used the global figures – all the feedback – since Friends and Family was established (see total response rate column). The pie chart below presents a very different picture of the NHS to the service utilisation one above.
Pie Chart two: Proportion of FFT Feedback by NHS Service

So, some areas have a disproportionately high level of Friends and Family Feedback while others have a disproportionately low level of Feedback
Disproportionately Higher feedback compared to activity
- Specialist Mental Health 10 times greater
- Hospital Admissions 6 times greater
- A and E attendance 3 times greater
- Dentistry 1.3 times greater
About the same
- Outpatient Appointment
Disproportionately lower feedback compared to activity
- General practice – 3 times lower feedback compared to activity
This variation in response creates a distorted view of what the NHS is – over 70% of feedback relates to hospital provision – yet this is a small part of the NHS compared to General Practice, Community Services and Dentistry.
It does appear that the bulk of the feedback comes from services that are more transactional – in-patient, A & E, Dentist and Outpatient. Relational Services such as General Practice struggle to keep up here.
This imbalance in the data probably pulls regulators and performance managers towards hospital based services and away from community. I suspect that it is also the case that Hospitals are easier to performance manage; there are fewer of them and they are higher profile than GPs – performance management systems are able to focus on them more and are more motivated to do so given that the bulk of NHS spend is directed towards them.
Looking at the data above it is tempting to say that the focus should be on getting GPs to increase the FFT returns. I am not so sure – I wonder whether we should be asking:
- what difference FFT has made to those services who have high rates of feedback such as A&E and In-Patients
- whether there is a demonstrable difference in the quality of their work compared to GPs.
I will be coming back to the Friends and Family test in future blogs.
What do you think?
A bit more about the data – activity data comes from three main sources:
- NHS utilisation data comes from the NHS Confederation
- NHS Dental Statistics
- GP data comes from page 12 of this NHS England report

I could not agree with you more i.e. that it would be good to hear much more from patients and carers who have used GP services. I think many patients would need to be able to provide comment via The Patients Association or some other independent body so that they can be “anonymous” in the Public Domain !
Interesting analysis, and your conclusions look sound. What I’m also wondering, given the purpose of service improvement and the volume of data, is how real this is? Your eloquent cartoon suggests not?
About time the friends and families test came under some more critical analysis. Looking forward to your next blog on what has changed as a result of the test. It will be fascinating to know if anyone has any data on that.